> For the complete documentation index, see [llms.txt](https://docs.ixhello.com/llms.txt). Markdown versions of documentation pages are available by appending `.md` to page URLs; this page is available as [Markdown](https://docs.ixhello.com/ixhc2/flows/flow-editor/ai-assistants/flow-debugging-user-guide.md).
# Flow Debugging User Guide
### Overview
Flow Debugging is an AI-powered capability that helps support engineers, QA users, and flow developers quickly investigate and troubleshoot flow executions without manually searching through Grafana logs and traces.
Instead of running complex Grafana queries, users can ask natural language questions about a flow run and receive detailed debugging information directly within the Debug Panel.
The solution is powered by System Flows, an LLM Agent, and a custom Grafana MCP Server that retrieves logs, traces, errors, and execution data from Grafana.
***
## Purpose
The Flow Debugging feature helps users:
* Analyze previous flow executions.
* Identify errors and warnings.
* View customer inputs submitted during a run.
* Retrieve session and trace information.
* Review execution timelines and component performance.
* Generate summaries of flow runs.
* Troubleshoot issues using natural language queries.
***
## Key Benefits
* **Simplified Troubleshooting**
* No need to navigate Grafana and execute complex log queries manually.
* **Natural Language Interaction**
* Ask questions in plain English and receive actionable debugging insights.
* **Faster Root Cause Analysis**
* Quickly identify failures, latency issues, warnings, and execution details.
* **Centralized Debugging Experience**
* Access logs, traces, summaries, and execution information from a single interface.
* **Improved Developer Productivity**
* Reduce investigation time and accelerate issue resolution.
***
## How Flow Debugging Works
#### Step 1: Execute a Flow
Run a flow through the application as usual.
#### Step 2: Open the Debug Panel
Navigate to the Debug Panel from the flow interface.
#### Step 3: Ask Questions
Enter natural language requests related to a flow execution.
Examples:
* What happened to my last run?
* **Response Includes**
* Session ID
* Execution timestamp
* Run status
* Errors (if any)
* Warnings (if any)
Example Result:
* Flow executed successfully.
* Session ID returned.
* No errors detected.
* No warnings detected.
**View Customer Inputs**
* Show the user inputs for the last run.
* The system displays customer inputs collected during the run.
* **User Input:**
* If redaction policies are enabled, sensitive information will be displayed in its redacted format.
**Debug response:**
**View Execution Traces**
* Give me the traces of the last execution.
* The system retrieves execution traces, including:
* Session creation
* Gateway processing
* Flow retrieval
* Component execution
* Processing duration
* Response generation
Example:
* Channel Gateway initiated session.
* Session processing took 387 ms.
* Flow retrieval timings displayed.
* Component execution timeline available.
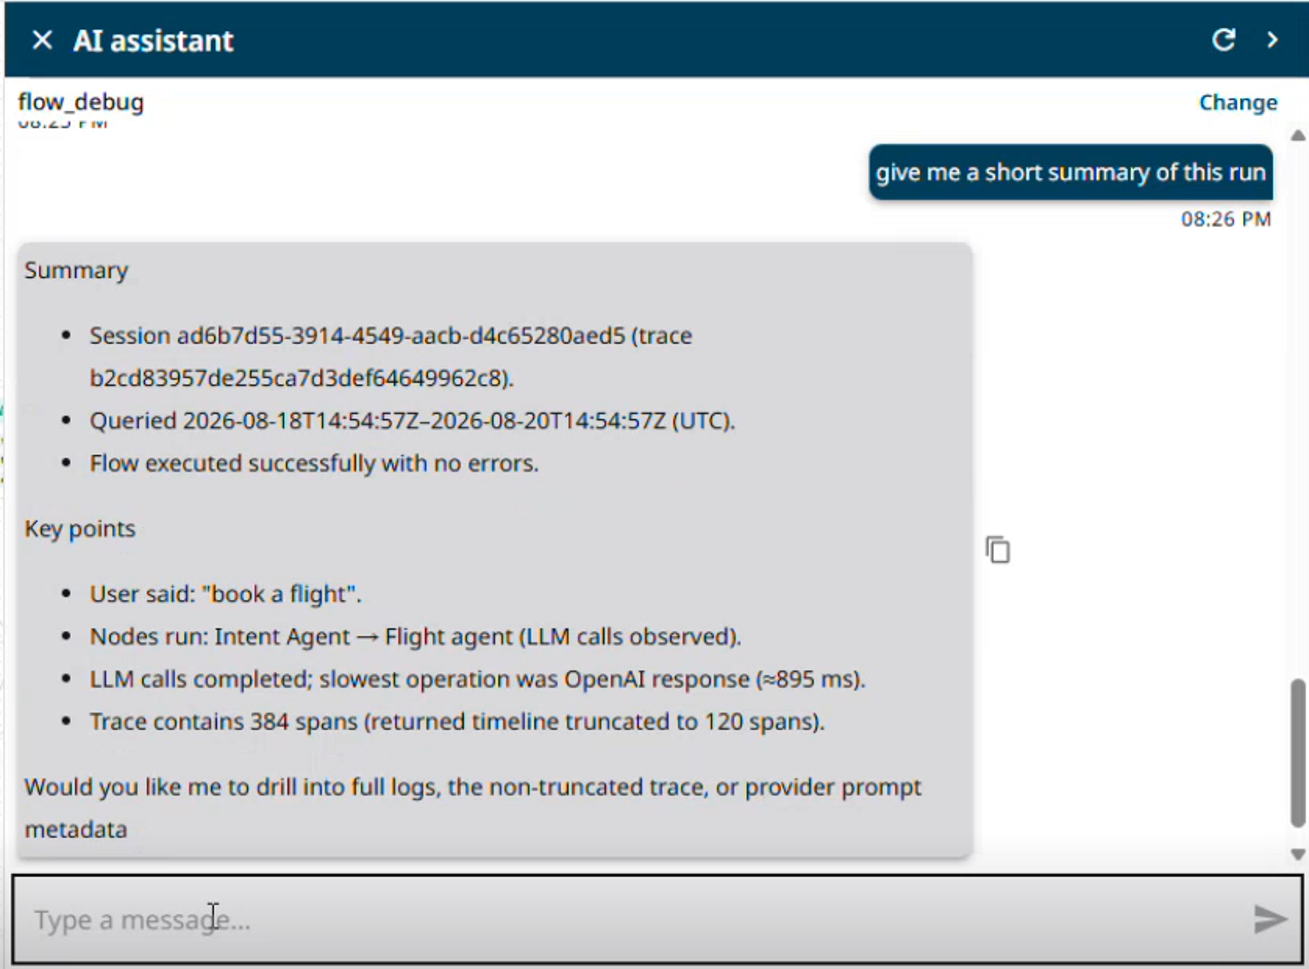
**Generate Flow Summary**
* Summarize the flow run.
* The AI agent generates a concise summary describing:
* User actions
* Flow progression
* Key inputs
* Execution outcome
* Any issues encountered
#### Step 4: Data Is Retrieved
Relevant information such as:
* Logs
* Traces
* Error details
* Service health
* Session information
is collected.
#### Step 5: Results Are Returned
The debugging response is displayed in the Debug Panel.
***
## Architecture Overview
Flow Debugging is built using System Flows and MCP-based integrations.
**Components:**
* **Debug Panel:** The interface where support or QA users submit debugging requests.
* **System Flow:** A predefined flow that handles debugging conversations and orchestrates data retrieval.
* **LLM Agent:** Processes user questions and determines which debugging tools should be invoked.
* **Grafana MCP Server:** Provides access to:
* Logs
* Traces
* Error patterns
* Service health metrics
* Execution details
* **Grafana Data Source:** Stores flow execution telemetry and diagnostic information used during debugging.
***
## Technical Workflow
* User Opens Debug Panel: A support user or QA user accesses the debugging interface.
* System Flow Loads: The platform loads the debugging system flow during runtime.
* User Submits a Query: The user asks a natural language debugging question.
* LLM Agent Processes Request: The agent analyzes the request and determines which tools are required.
* MCP Tools Retrieve Data: The Grafana MCP Server executes queries against available telemetry sources.
***
## Current Scope
The current release provides the first version of Flow Debugging and supports:
* Run investigation
* User input inspection
* Session analysis
* Trace visualization
* Execution summaries
* Error identification
* Historical run lookup
Additional enhancements are planned to provide deeper debugging capabilities and more advanced flow analysis.
***
## Conclusion
Flow Debugging simplifies flow investigation by allowing users to interact with execution data using natural language. By combining System Flows, an AI-powered LLM agent, and a custom Grafana MCP Server, users can quickly access logs, traces, errors, and execution insights without manually navigating Grafana. This significantly reduces troubleshooting effort, accelerates root cause analysis, and improves the overall developer and support experience.
---
# Agent Instructions
This documentation is published with GitBook. GitBook is the documentation platform designed so that both humans and AI agents can read, navigate, and reason over technical content effectively. Learn more at gitbook.com.
## Querying This Documentation
If you need additional information that is not directly available in this page, you can query the documentation dynamically by asking a question.
Perform an HTTP GET request on the current page URL with the `ask` query parameter, and the optional `goal` query parameter:
```
GET https://docs.ixhello.com/ixhc2/flows/flow-editor/ai-assistants/flow-debugging-user-guide.md?ask=&goal=
```
`ask` is the immediate question: it should be specific, self-contained, and written in natural language.
`goal` is optional and describes the broader end goal you are ultimately trying to accomplish on behalf of the user. GitBook uses it to tailor the answer towards what is most useful for that goal.
The response will contain a direct answer to the question and relevant excerpts and sources from the documentation.
Use this mechanism when the answer is not explicitly present in the current page, you need clarification or additional context, or you want to retrieve related documentation sections.